
Interaction to Next Paint (INP): Complete Guide to Google’s Core Web Vital
Interaction to Next Paint (INP) is Google’s newest Core Web Vital metric that replaced First Input Delay (FID) in March 2024, measuring how quickly a web page responds to user interactions throughout the entire page lifecycle.
Unlike FID, which only tracked the first interaction, INP monitors all user interactions and measures the complete responsiveness cycle from user input to visual feedback.
This comprehensive guide covers everything you need to understand, measure, and optimize INP performance to improve your website’s search rankings and user experience.
What This Guide Covers
This guide focuses specifically on INP as a Core Web Vital metric, including measurement techniques using real user monitoring and lab tools, systematic optimization strategies for reducing interaction delays, and troubleshooting common responsiveness issues. We won’t cover other meanings of the INP acronym or unrelated performance metrics.
Who This Is For
This guide is designed for web developers, SEO professionals, and site owners managing website performance. Whether you’re optimizing an existing site with poor INP scores or implementing INP-friendly practices from scratch, you’ll find actionable strategies and measurement techniques.
Why This Matters
INP directly impacts your website’s search engine rankings as part of Google’s Core Web Vitals assessment, affecting organic visibility and traffic. Poor responsiveness also degrades user experience, leading to higher bounce rates and reduced conversions when user interactions feel sluggish or unresponsive.
What You’ll Learn
- How INP measures page responsiveness across all user interactions
- Differences between INP and First Input Delay, and why Google made the switch
- Field data and lab environment measurement techniques for accurate INP assessment
- Step-by-step optimization strategies targeting input delay, processing time, and presentation delay
- Common INP challenges and proven solutions for improving responsiveness
Understanding Interaction to Next Paint
INP is a responsiveness metric that measures the latency of all user interactions with a web page, from the moment a user interacts with page elements until the next frame is painted with visual feedback.
This Core Web Vital metric captures the complete interaction lifecycle, providing a comprehensive view of how quickly your website responds to user input throughout a user’s visit.
INP measures the time from when user interactions occur—such as user clicks, key presses, or touches on mobile devices—until the browser presents the next visual update reflecting that interaction. This approach gives a realistic picture of page responsiveness that users actually experience during real world user experiences.
The metric focuses on discrete interactions rather than continuous events, tracking individual clicks, taps, and keyboard input rather than scrolling or hovering. INP provides a more complete responsiveness assessment than previous metrics by evaluating the entire interaction timeline rather than isolated components.
Core Components of INP
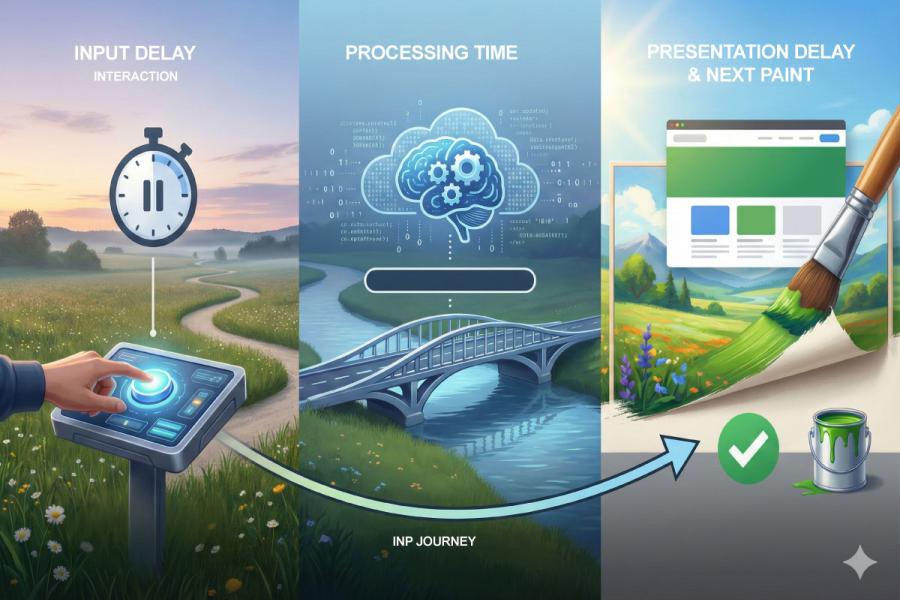
INP measurement consists of three distinct phases that combine to create the total interaction delay users experience.
Input Delay represents the time from when an interaction starts until the main thread becomes available to process the event handlers. During this phase, the browser may be busy with other JavaScript code, long tasks, or processing that prevents immediate response to user input.
Processing Duration covers the time spent executing event listeners and any synchronous operations triggered by the interaction. This includes running multiple event handlers, DOM manipulation, calculations, and other JavaScript operations directly related to the user’s action.
Presentation Delay measures the time from when processing completes until the browser paints the next frame showing the visual changes. This phase includes layout calculations, style computations, and the actual rendering work needed to display the interaction results to users.
INP vs First Input Delay (FID)
First Input Delay suffered from significant limitations that made it an incomplete measure of page responsiveness. FID only measured input delay for the first interaction during a page visit, ignoring all subsequent user interactions that often represent the majority of user engagement with page elements.
INP addresses these shortcomings by tracking the longest interaction observed during the entire user visit, excluding outliers to focus on representative responsiveness. This approach captures poor responsiveness that occurs throughout the page lifecycle, not just during initial page load when FID was measured.
Google replaced FID with INP in Core Web Vitals because INP provides actionable insights into actual user experience problems. While a site might pass FID with good initial responsiveness, users could still experience frustrating delays during later interactions that INP successfully identifies and measures.
The migration to INP means existing FID optimizations may need adjustment, as improving input delay alone won’t guarantee good INP scores if processing time or presentation delay remain problematic.
Measuring INP Performance
Accurate INP measurement requires understanding the differences between field data collected from real user monitoring and lab data gathered in controlled testing environments. Field data reflects actual user experiences across different devices, network conditions, and usage patterns, while lab data provides controlled conditions for detailed analysis.
Real user monitoring provides the most reliable INP assessment because the metric heavily depends on device performance, network conditions, and actual user behavior patterns that vary significantly across your user base.
Field Data Measurement
Chrome User Experience Report (CrUX) provides origin-level INP data collected from Chrome users who have opted into usage statistics sharing. This data appears in Google Search Console’s Core Web Vitals report and PageSpeed Insights, offering insights into how real users experience your site’s responsiveness.
Real User Monitoring (RUM) tools enable detailed tracking of specific interaction types and pages, providing granular INP data beyond what CrUX offers. RUM solutions can identify which particular interactions cause poor INP scores and track improvements over time as optimizations are implemented.
Google Search Console reports Core Web Vitals metrics including INP, categorizing pages as Good, Needs Improvement, or Poor based on field data. This tool helps identify which page groups have INP issues and tracks progress as you implement optimizations.
The web vitals JavaScript library allows custom INP tracking implementation, enabling developers to capture detailed interaction data and send it to analytics platforms for analysis. This approach provides maximum flexibility in understanding how users interact with specific page elements.
Lab Environment Testing
Chrome DevTools Performance Panel provides detailed analysis of individual interactions, breaking down the input delay, processing duration, and presentation delay components. The performance tab enables frame-by-frame analysis of interaction handling and identifies specific bottlenecks in the interaction pipeline.
PageSpeed Insights lab testing offers controlled INP assessment, though results may not reflect real world user experiences due to simulated conditions. Lab tools work best for identifying potential issues and validating optimization effectiveness under controlled circumstances.
Total Blocking Time (TBT) serves as a useful INP proxy during lab testing, measuring main thread blocking during page load. While TBT doesn’t directly correlate with INP, reducing TBT often improves INP by making the main thread more available for interaction processing.
Best practices for lab environment testing include simulating realistic user interaction patterns, testing across different device types represented in your user base, and focusing on interactions that occur most frequently in real usage scenarios.
INP Scoring Thresholds
Good INP performance requires response times under 200 milliseconds for optimal user experience. This threshold ensures that interactions feel immediate and responsive, meeting user expectations for modern web interfaces.
Poor INP scores occur when interactions take over 500 milliseconds to complete, creating noticeably sluggish user experiences. Users perceive delays over 500ms as slow, leading to frustration and potential abandonment of tasks or pages.
INP measurement uses the 75th percentile methodology, meaning that 75% of page interactions must meet the good threshold for the page to receive a good INP score. This approach ensures that most user interactions feel responsive while allowing for occasional slower interactions that don’t represent the typical user experience.
The metric is assessed separately for mobile and desktop devices, recognizing that device capabilities and user interaction patterns differ significantly between these platforms.
INP Optimization Strategies
Systematic INP improvement requires identifying problematic interactions before implementing optimizations, as different interaction types may suffer from different performance bottlenecks. Effective optimization targets the specific components causing delays rather than applying generic performance improvements that may not address actual INP issues.
Understanding which interactions cause poor INP scores enables focused optimization efforts that deliver measurable improvements. Random performance optimizations without identifying root causes often fail to improve INP meaningfully.
Step-by-Step: INP Improvement Process
- Identify slow interactions using field data and RUM tools: Start with real user monitoring to understand which specific interactions cause poor responsiveness in production environments. Focus on interactions that occur frequently and affect significant portions of your user base.
- Reproduce interactions in Chrome DevTools for detailed analysis: Use the Performance Panel to capture problematic interactions and analyze the breakdown of input delay, processing duration, and presentation delay. This step reveals which component contributes most to poor responsiveness.
- Analyze main thread blocking and long tasks during interactions: Identify JavaScript operations, third-party scripts, or other processes that block the main thread when user interactions occur. Long tasks that overlap with interaction processing directly impact INP performance.
- Implement targeted optimizations based on component analysis: Address the specific bottlenecks identified in analysis, whether input delay from blocked main thread, processing time from heavy event handlers, or presentation delay from complex DOM operations.
- Validate improvements using both field and lab data: Monitor INP improvements through real user monitoring to confirm optimizations work in production, while using lab tools to verify that changes don’t introduce new performance issues.
Reducing Input Delay
Minimizing main thread blocking tasks during user interactions requires careful management of JavaScript execution timing. Long tasks that run when users attempt to interact directly contribute to input delay by preventing immediate event handler execution.
Breaking up long JavaScript execution into smaller chunks using setTimeout or scheduler.postTask allows the browser to process user interactions between chunks. This approach maintains functionality while ensuring the main thread remains available for responding to user input.
Avoiding heavy operations during page load and critical interaction windows reduces the likelihood of input delay when users first engage with page elements. Defer non-essential JavaScript operations until after initial user interactions are likely to occur.
Task scheduling strategies enable better responsiveness by yielding control back to the browser regularly during long-running operations, ensuring that user interactions can be processed promptly even when complex operations are ongoing.
Optimizing Processing Time
Streamlining event handler execution involves removing unnecessary callbacks, optimizing DOM queries, and minimizing synchronous operations within interaction processing. Heavy processing during event handlers directly increases processing duration and degrades INP performance.
Deferring non-critical operations prevents blocking interaction processing with work that doesn’t immediately affect the user’s intended action. Use asynchronous operations for analytics tracking, non-essential DOM updates, and other operations that can happen after the primary interaction response.
Code splitting and lazy loading reduce JavaScript bundle sizes, decreasing parse and execution time that can interfere with interaction processing. Smaller initial bundles mean less code competing for main thread resources when interactions occur.
Optimizing analytics and third-party script execution timing prevents different scripts from blocking interaction processing. Load non-essential scripts after user interactions are likely, or use async/defer attributes to prevent blocking main thread resources.
Minimizing Presentation Delay
Reducing DOM complexity helps the browser render updates more quickly after interaction processing completes. Pages with fewer than 1,400 DOM nodes typically experience faster rendering, leading to shorter presentation delays and better overall INP scores.
Optimizing CSS and layout calculations reduces the time needed to compute visual changes after interactions. Avoid complex selectors, minimize layout-triggering properties, and use CSS containment to limit the scope of style recalculations.
Avoiding heavy operations in requestAnimationFrame callbacks prevents blocking the next frame paint after interaction processing. Keep animation callbacks lightweight and defer heavy work to prevent extending presentation delay.
Prioritizing above-the-fold content for faster visual updates ensures that interaction feedback appears quickly in the viewport where users expect immediate response. Optimize critical rendering path elements that affect visible interaction responses.
Comparison: Server-Side vs Client-Side Rendering Impact
Feature | Server-Side Rendering (SSR) | Client-Side Rendering (CSR) |
|---|---|---|
Initial INP Performance | Better due to chunked HTML parsing | Worse due to large JavaScript bundles |
Main Thread Availability | Higher availability during initial interactions | Lower due to framework hydration |
DOM Complexity | Controlled, optimized structure | Often larger, JavaScript-generated |
Resource Loading | Distributed across multiple requests | Heavy initial JavaScript load |
Interaction Readiness | Faster time to interactive | Delayed by framework initialization |
Server-side rendering generally provides better initial INP performance because content arrives as HTML that browsers can parse incrementally, reducing main thread blocking during early user interactions. However, SSR requires careful implementation to avoid hydration-related performance issues.
Client-side rendering faces challenges with large JavaScript bundles that must execute before interactions become fully responsive, though modern frameworks have improved significantly with code splitting and progressive enhancement techniques.
Common INP Challenges and Solutions
Production environments frequently encounter specific patterns of INP problems that can be addressed through targeted optimization strategies. Understanding these common issues enables faster diagnosis and resolution of responsiveness problems affecting real users.
Challenge 1: Long Tasks Blocking Main Thread
Long tasks that exceed 50 milliseconds block the main thread and prevent immediate response to user interactions, directly contributing to input delay and poor INP scores.
Solution: Implement task scheduling and yielding with setTimeout or scheduler.postTask to break monolithic JavaScript execution into smaller chunks. This approach allows the browser to process user interactions between task chunks, maintaining responsiveness during heavy operations.
Modern browsers support scheduler.postTask for more precise task scheduling, while setTimeout provides broader compatibility for yielding control back to the browser during long-running operations.
Challenge 2: Heavy Third-Party Scripts
Third-party scripts for analytics, advertising, social media, and other services often execute at inappropriate times, blocking the main thread when users attempt to interact with page elements.
Solution: Defer non-critical scripts using async and defer attributes, implement loading prioritization to ensure interaction-critical code executes first, and consider loading third-party scripts only after user engagement is detected.
Evaluate whether all third-party scripts are essential for initial page functionality, and remove or defer scripts that don’t directly support core user interactions during the critical interaction period.
Challenge 3: Large DOM and Complex Layouts
Pages with excessive DOM nodes or complex CSS layouts require more processing time for interaction-triggered updates, leading to longer presentation delays and poor INP performance.
Solution: Optimize DOM structure to stay under 1,400 nodes when possible, implement virtual scrolling for large lists, reduce layout complexity through simplified CSS, and use CSS containment to limit the scope of style recalculations triggered by interactions.
Consider using CSS Grid and Flexbox for more efficient layouts that require less computational overhead during dynamic updates triggered by user interactions.
Challenge 4: Interaction Overlap and Rapid User Input
Users often interact rapidly with multiple page elements, creating overlapping interactions that can overwhelm processing capabilities and create cumulative delays affecting the final INP value.
Solution: Implement debouncing and throttling for interactions that don’t require immediate response, use proper event management to prevent multiple event handlers from processing simultaneously, and prioritize user-visible interactions over background processing.
Design interaction patterns that handle rapid user input gracefully, ensuring that the most recent interaction takes priority when processing resources are limited.
Conclusion and Next Steps
INP represents a critical evolution in measuring page responsiveness, providing comprehensive insights into user experience quality throughout entire page visits rather than just initial interactions. As Google’s newest Core Web Vital, optimizing INP directly impacts search rankings while improving actual user satisfaction with your website’s responsiveness.
To get started:
- Audit current INP performance using Google Search Console to identify which pages and page groups currently have INP issues affecting your search performance
- Set up real user monitoring to identify problematic interactions and understand which specific user interactions cause the longest delays in production environments
- Begin optimization with highest-impact, lowest-effort improvements such as deferring non-critical JavaScript and breaking up long tasks that block the main thread during common interactions
Related Topics: Optimizing other Core Web Vitals like Largest Contentful Paint (LCP) and Cumulative Layout Shift (CLS), implementing performance budgets for ongoing INP monitoring, and establishing monitoring strategies to track INP improvements over time.
Additional Resources
- Google’s official INP documentation at web.dev provides comprehensive technical details and measurement guidelines
- Chrome DevTools performance profiling tutorials for analyzing interaction components and identifying optimization opportunities
- Web-vitals JavaScript library documentation for implementing custom INP tracking and measurement
- Browser extensions and monitoring tools for ongoing INP assessment and real-time debugging during development
Changed